CSV files are widely used for storing and sharing structured data. But when you need to monitor trends, track performance, or make quick decisions, static tables aren’t enough. That’s where real-time dashboards come in.
These tools help transform CSV data into live visuals, making your information more accessible, interactive, and actionable.
What Is a Real-Time CSV Dashboard?
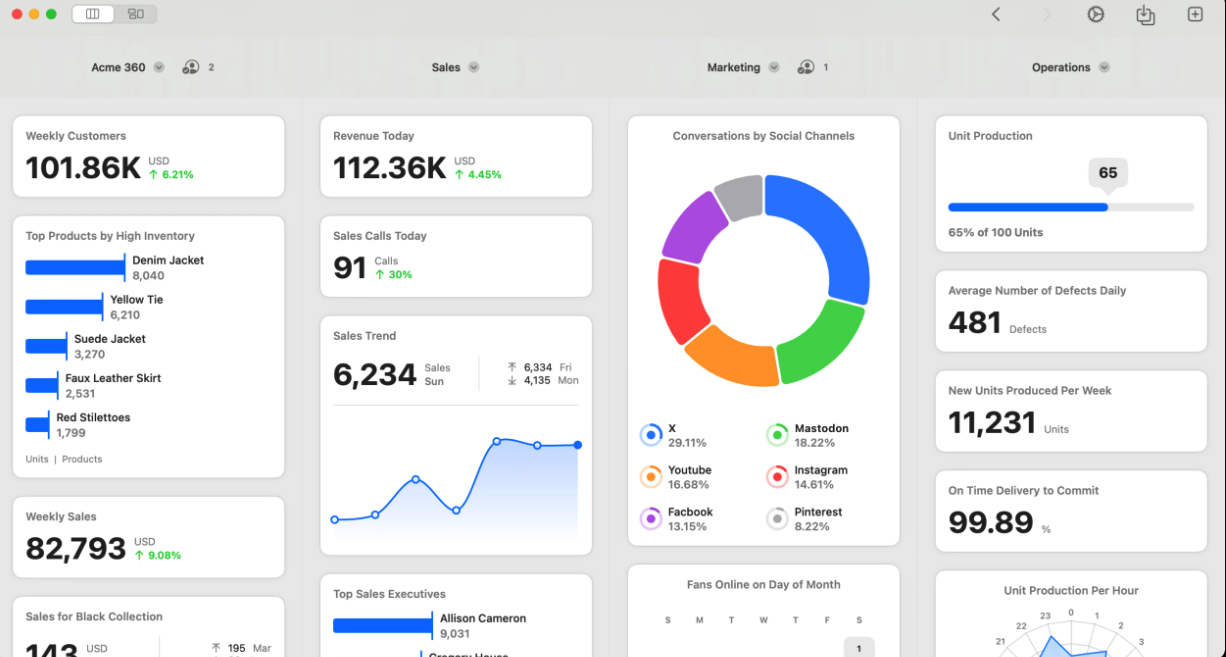
A real-time dashboard connects to a CSV file and automatically updates as the data changes. It offers a visual overview of your key metrics without needing to manually refresh or reload files.
These dashboards are often used in fields like sales, finance, marketing, and operations to get a quick pulse on performance and trends.
Key Features of Modern CSV Dashboards
Most real-time CSV dashboards include:
Some tools even support automation, allowing you to schedule updates or connect directly to cloud CSV sources like Google Sheets or FTP directories.
Stay Updated With Us
At CSV Loader, we keep you informed on the latest tools, trends, and best practices in the world of CSV files. Follow our blog for regular insights on working smarter with your data.
Your data deserves more than just rows and columns.
These tools help transform CSV data into live visuals, making your information more accessible, interactive, and actionable.
What Is a Real-Time CSV Dashboard?
A real-time dashboard connects to a CSV file and automatically updates as the data changes. It offers a visual overview of your key metrics without needing to manually refresh or reload files.
These dashboards are often used in fields like sales, finance, marketing, and operations to get a quick pulse on performance and trends.
Key Features of Modern CSV Dashboards
Most real-time CSV dashboards include:
- Live updates – See changes as they happen without re-uploading the file.
- Multiple chart types – Visualize data through bar charts, line graphs, pie charts, heatmaps, and more.
- Custom filters – Let users drill down by time periods, categories, or regions.
- Responsive layout – Access dashboards from any device, including mobile.
- Sharing and embedding options – Make your dashboard available to teams, stakeholders, or websites.
Some tools even support automation, allowing you to schedule updates or connect directly to cloud CSV sources like Google Sheets or FTP directories.
Stay Updated With Us
At CSV Loader, we keep you informed on the latest tools, trends, and best practices in the world of CSV files. Follow our blog for regular insights on working smarter with your data.
Your data deserves more than just rows and columns.